Friday, January 4, 2013

0 Establishment Survey +155,000 Jobs; Household Survey +28,000 Jobs; Unemployment Rate Revised Up, Flat Since September

Initial Reaction

The establishment survey report of +155,000 jobs was about what most expected.

However, beneath the surface, this report looks weak.

The household survey shows a gain of a mere 28,000 jobs. The unemployment rate stayed the same although the number of people unemployed rose by 164,000.

December BLS Jobs Report at a Glance

  • Payrolls +155,000 - Establishment Survey
  • US Employment +28,000 - Household Survey
  • Involuntary Part-Time Work -220,000 - Household Survey
  • Baseline Unemployment Rate +.00 at 7.8% - Household Survey
  • U-6 unemployment +.00 to 14.4% - Household Survey
  • The Civilian Labor Force +192,000 - Household Survey
  • Not in Labor Force  -16,000 - Household Survey
  • Participation Rate +.00 to 63.6 - Household Survey


Recall that the unemployment rate varies in accordance with the Household Survey not the reported headline jobs number, and not in accordance with the weekly claims data.

Quick Notes About the Unemployment Rate

  • Last month it was reported the US unemployment rate fell -.2 to 7.7%
  • This month the unemployment rate was reported flat at 7.8% (so last month was revised up)
  • In the last year, those "not" in the labor force rose by 2,199,000
  • Over the course of the last year, the number of people employed rose by 2,436,000
  • Long-Term unemployment (27 weeks and over) was 4,766,000 a decline of 16,000
  • Ratio of long-term unemployment to overall unemployment is 39.1%. Once someone loses a job it is still very difficult to find another.


December 2012 Jobs Report

Please consider the Bureau of Labor Statistics (BLS) December 2012 Employment Report.

Nonfarm payroll employment rose by 155,000 in December, and the unemployment rate was unchanged at 7.8 percent, the U.S. Bureau of Labor Statistics reported today. Employment increased in health care, food services and drinking places, construction, and manufacturing.

Click on Any Chart in this Report to See a Sharper Image

Unemployment Rate - Seasonally Adjusted


Nonfarm Employment - Payroll Survey - Annual Look - Seasonally Adjusted


Employment is above the total just prior to the 2001 recession, and about where it was in mid-2005.

Nonfarm Employment - Payroll Survey Monthly Changes - Seasonally Adjusted


click on any chart for sharper image

Between January 2008 and February 2010, the U.S. economy lost 8.8 million jobs.

Since the employment low in February 2010, nonfarm payrolls have expanded by about 5.3 million jobs. Of the 8.8 million jobs lost between January 2008 and February 2010, approximately 60.22% have been recovered (not accounting for normal demographic-related job growth).

In 2012, employment grew by an average of 153,000 per month, the same as the average monthly gain for 2011.

Statistically, 125,000+- jobs a month is enough to keep the unemployment rate flat. For a discussion, please see Question on Jobs: How Many Does It Take to Keep Up With Demographics?

Once again, recall unemployment is based on the household survey.


Current Report Jobs


Average Weekly Hours


Average weekly hours have improved substantially but are still below where they were at the start of the recession.

Index of Aggregate Weekly Hours
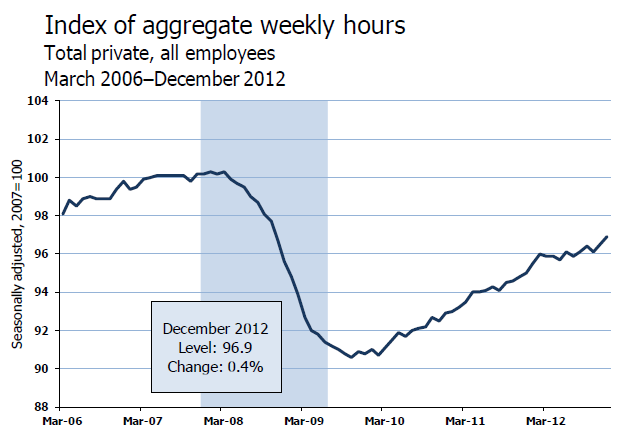


The index of aggregate hours paints a good picture of the stall in the recovery. Employment is up, but hours are not up proportionally.

Average Hourly Earnings vs. CPI


Average hourly earnings has been falling for years and lagging CPI inflation since September 2009. Simply put real wages have been declining. Add in increases in state taxes and the average Joe has been hammered pretty badly.

For further discussion, please see What's "Really" Behind Gross Inequalities In Income Distribution?

BLS Birth-Death Model Black Box

The BLS Birth/Death Model is an estimation by the BLS as to how many jobs the economy created that were not picked up in the payroll survey.

The Birth-Death numbers are not seasonally adjusted, while the reported headline number is. In the black box the BLS combines the two, coming up with a total.

The Birth Death number influences the overall totals, but the math is not as simple as it appears. Moreover, the effect is nowhere near as big as it might logically appear at first glance.

Do not add or subtract the Birth-Death numbers from the reported headline totals. It does not work that way.

Birth/Death assumptions are supposedly made according to estimates of where the BLS thinks we are in the economic cycle. Theory is one thing. Practice is clearly another as noted by numerous recent revisions.

Birth Death Model Adjustments For 2011


Birth Death Model Adjustments For 2012


Birth-Death Notes

Once again: Do NOT subtract the Birth-Death number from the reported headline number. That approach is statistically invalid.

In general, analysts attribute much more to birth-death numbers than they should. Except at economic turns, BLS Birth/Death errors are reasonably small.

For a discussion of how little birth-death numbers affect actual monthly reporting, please see BLS Birth/Death Model Yet Again.

Household Survey Data


click on chart for sharper image

In the last year, the civilian noninstitutional population rose by 3,766,000. Yet the labor force only rose by 1,566,000.

Those "not" in the labor force rose by 2,199,000 to 88,839,000.

The massive rise of those "not" in the labor force is primarily economic weakness, not demographics. Actually, older workers are returning to the work force because they cannot afford retirement. One look at the average age of Walmart greeters and those working in fast food restaurants tells a story itself.

Decline in Labor Force Factors

  1. Discouraged workers stop looking for jobs
  2. People retire because they cannot find jobs
  3. People go back to school hoping it will improve their chances of getting a job
  4. People stay in school longer because they cannot find a job

Were it not for people dropping out of the labor force, the unemployment rate would be well over 10%.

Part Time Status (in Thousands)


click on chart for sharper image

There are 7,918,000 workers who are working part-time but want full-time work. This is a volatile series.

BLS Alternate Measures of Unemployment


click on chart for sharper image

Table A-15 is where one can find a better approximation of what the unemployment rate really is.

Notice I said "better" approximation not to be confused with "good" approximation.

The official unemployment rate is 7.8%. However, if you start counting all the people who want a job but gave up, all the people with part-time jobs that want a full-time job, all the people who dropped off the unemployment rolls because their unemployment benefits ran out, etc., you get a closer picture of what the unemployment rate is. That number is in the last row labeled U-6.

U-6 is much higher at 14.4%. Both numbers would be way higher still, were it not for millions dropping out of the labor force over the past few years.

Duration of Unemployment
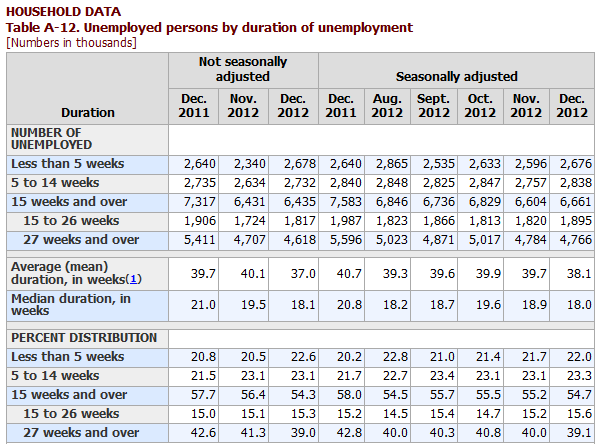


Long-term unemployment remains in a disaster zone with 39% of the unemployed in the 27 weeks or longer category.

Grossly Distorted Statistics

Given the complete distortions of reality with respect to not counting people who allegedly dropped out of the work force, it is easy to misrepresent the headline numbers.

Digging under the surface, the drop in the unemployment rate over the past two years is nothing but a statistical mirage. Things are much worse than the reported numbers indicate.

Last month shows pronounced weakness in the underlying numbers, this month was weak again.

For a look ahead to 2013, please see Small Business Owners' Hiring Intent Plunges to 2008 Lows; Don't Blame Sandy or Fiscal Cliff.

Mike "Mish" Shedlock
http://economic-trends.blogspot.com

"Wine Country" Economic Conference Hosted By Mish
Click on Image to Learn More

Thursday, January 3, 2013

0 Nikkei Soars as Yen Sinks to 30-Month Low

Inquiring minds note the Nikkei is up 293 points (2.8%) to 10,688 as the Japanese 30-Year Yield is Highest Since 2011.
Thirty-year yields climbed to levels unseen since December 2011, tilting the so-called yield curve to the steepest level in 17 months. Japan’s newly installed Prime Minister Shinzo Abe said in a New Year’s statement that “bold” monetary policy is one of the three prongs of his economic measures.

The yield on the 30-year bond touched 1.995 percent, the most since Dec. 2, before trading at 1.99 percent as of 3:21 p.m. in Tokyo from 1.975 percent on Dec. 28, according to Japan Bond Trading Co., the nation’s largest interdealer debt broker.

Japan’s Nikkei 225 (NKY) Stock Average jumped 2.8 percent after the Standard & Poor’s 500 Index in the U.S. on Jan. 2 reached its highest close since September. The yen touched 87.83 per dollar, the weakest since July 28, 2010, extending its longest series of weekly declines since 1989.
Yen Weekly


click on chart for sharper image

I happen to think Prime Minister Shinzo Abe is serious about causing inflation in Japan. The currency market seems to agree as well.

However, the yield on the 30-year bond is only 2%, which is nothing to get that excited over. For now, the bond market is not treating Abe's inflation threat that seriously. If and when the bond market does react, Abe will not like the state of affairs one bit.

Mike "Mish" Shedlock
http://economic-trends.blogspot.com

0 I'll Believe It When I See It

Here's one for the "I'll Believe It When I See It" file: Backlash pushes Republicans to seek cuts.
A conservative backlash against Republicans over their deal with Barack Obama to lift taxes has hardened the party leadership’s resolve to demand huge spending cuts as the price for increasing the country’s borrowing limit.

Mitch McConnell, the Republican Senate minority leader, rejecting Mr Obama’s statement that he would not negotiate over the issue, said the debt ceiling debate in coming months was the ideal time to force the administration to cut outlays.

“The President may not want to have a fight about government spending over the next few months, but it’s the fight he is going to have, because it’s a debate the country needs,” Mr McConnell said in an opinion article on Yahoo.com.

Mr McConnell, who is up for election in 2014, and his Republican colleagues in the Senate, have been stung by criticism on the right for their role in brokering a deal with the White House over the fiscal cliff.

The final deal, negotiated between Mr McConnell and Joe Biden, the vice-president, was passed overwhelmingly in the Senate, marking the first time Republicans in Washington have voted for income tax increases in more than two decades.

The administration had also wanted to adopt a proposal first advanced by Mr McConnell, which would have curtailed the ability of Congress’ to refuse to limit the debt ceiling.

But Mr McConnell no longer seems to support this plan and also says that the fiscal cliff agreement is the last time Republicans will support tax increases.

“The moment he [Obama] and virtually every elected Democrat in Washington signed off on the terms of the current arrangement, it was the last word on taxes. That debate is over,” he said.
Does anyone believe the Republicans will really hold out for budget cuts? I sure don't after all the white flag waving we have seen.

I sure hope I am wrong, but what I fully expect is another can-kicking exercise in which Republicans cave in on cuts to entitlements in return for Democrats caving in on cuts to military.

Mike "Mish" Shedlock
http://economic-trends.blogspot.com 

0 60% of Spanish Companies are Losing Money, Social Unrest Evident; Unemployment Rate Drops

Via Google translate from Libre Mercado, Joan Rosell, the president of the Spanish Confederation of Employer Organizations (CEOE) has estimated 60% of Spanish Companies are Losing Money.

This is a Mish-modified translation of some key snips.
In an interview with the newspaper La Razon, Rosell said that "social unrest is evident and the business world is no exception."

The private sector "has already made ​​all the restructuring that had to do and the decline in employment in the private sector has virtually stopped. Now is the time for restructuring the public sector."

After defining the first year of Mariano Rajoy's government as a year of shock, Rosell has considered that the Spanish economy has "superfluous fat on many sides: Central government, regional and local. We are a hyper-regulated country".

Still, the CEOE president has identified several dynamic sectors in the economy, such as tourism, and exports (automobile, capital goods, power and chemical), and Rosell points out that Spain is gaining positions and externally against France , Italy or Germany.
Unemployment Rate Drops

According to the Financial Times, Spain's unemployment rate fell in December. This is the first drop in unemployment since July. However, that drop follows heavy job losses in the prior two months.
Spain saw a slight drop in the number of registered unemployed in December, in a welcome but most probably fleeting boost to the recession-plagued economy.

According to figures released by the ministry of labour on Thursday, the number of unemployed Spaniards fell by 59,094 between November and December. This followed two months of heavy back-to-back job losses, and left the overall number of unemployed 1.2 per cent lower at just under 4.85m.

December is usually a relatively strong month for the Spanish jobs market, as retailers, restaurants and other service providers bolster their staff ahead of the Christmas season. Even by that standard, however, the past month was exceptionally buoyant: according to Spain’s labour ministry, the drop in the number registered unemployed was the largest on record.

Raj Badiani, an economist with IHS Global Insight, described the December figures as a “rare piece of good news”, but pointed out that the rise in employment was the result of a “temporary fillip to short-term service sector employment”.

Most economists expect the Spanish unemployment rate to remain above 25 per cent in 2013, and for the economy as a whole to endure another year of recession.
Hyper-Regulation with Bloated Public Sector

Here is the problem in a nutshell: Spain is indeed a hyper-regulated economy, with a banking system that is insolvent, a hugely bloated public sector, unemployment over 25%, and youth unemployment over 50%.

Structural problems remain and over half of businesses are losing money. Don't get too excited about a seasonal rebound in hiring.

Mike "Mish" Shedlock
http://economic-trends.blogspot.com 

0 Glass Half Missing? What About Healthcare Premiums? What's the Hit to GDP?

I have seen Fiscal Cliff analysis written from two perspectives

1. Republicans Caved In
2. Democrats Caved In

Theory number 1 (Mine and others) says Congress punted the ball and Republicans waived the white flag. Given that virtually nothing has been done about the deficit, I fail to see how there can possibly be any debate on this. Yet there is.

Theory number 2 (primarily liberals) still blames Bush for the "Bush Era" tax cuts, while moaning about spending cuts that did not happen, and bitching that not enough tax hikes occurred on the wealthy. Curiously, the "Bush Era" tax cuts are now the "Obama Era" tax cuts and even the AMT problem was allegedly fixed.

A subset of the proponents of perspective number 2, people are bitching the "temporary 2-percent reduction in Social Security taxes" just expired.  Payroll taxes will jump from 4.2% to 6.2% of income for everyone.

In the glass half missing theory, this will cause a 1% hit to GDP so it should not have been done. This set of folks wanted "temporary" to become permanent, while simultaneously bitching about the "Bush Era" tax cuts.

Lost in the entire debate is how the country can possibly afford any of this.

What About Healthcare Premiums?

Let's assume for the moment that the expiring payroll tax cut will amount to a hit on GDP of about 1 percent. Reader Greg writes ...
Hello Mish

One thing I have not heard a lot of chatter on is the size of the increase in healthcare premiums most small to medium-sized companies are experiencing.  I have involvement with 3 companies and all three have seen quotes from current providers with an average increase over 30%. 

It's hard to extrapolate this, as in small companies it only takes 1 or 2 serious illnesses to jack the costs.  However, I've yet to talk to anyone that has seen anything less than a 10% jump.  And if employers pass along 30-40% of the costs to employees that could add another 1-2% out of each employees paycheck, which doubles the whole FICA thing. Greg
I am not quite sure how to total this either, but Obamacare is having some peculiar effects to say the least.

Many businesses are shifting even more to part-time employment, and given there are no incentives anywhere to reduce healthcare costs, those costs will continue to rise, taking a bite of the checks of workers, and giving employers additional reasons to not hire in the first place.

Mike "Mish" Shedlock
http://economic-trends.blogspot.com
 
back to top //PART 2